Data sources
❗ Important: The documentation in this topic refers to a feature or product that is currently in Early Availability status. Features in Early Availability status are only available in production to a limited number of customers based on fit with specific use cases. For more information about Early Availability status, see Product lifecycle phases. If you would like to use the product capabilities described here during the Early Availability phase, contact your AppDirect technical representative.
Find your focus
It is important to have a basic understanding of what data you want to monitor and where it comes from.
If you are a company founder or executive, combining a wide portfolio of data sources that fully summarizes company activity might be your chosen route. If you are a VP or middle manager you may be more focused in your approach, with just a single company team or data source to monitor. Or perhaps you plan to use AppInsights as a visual engine to represent data sets via our API.
Connect your data
There are four different methods for surfacing data within AppInsights:
Service integrations—AppInsights offers over 70 direct connections to popular web services. These integrations have been built from the ground up by our developers using open APIs that will make it particularly easy for you to surface and monitor common metrics from these services. You can find a full list of integrations on our data sources page, or from within the app by clicking the blue “+” button at the top left of the screen.
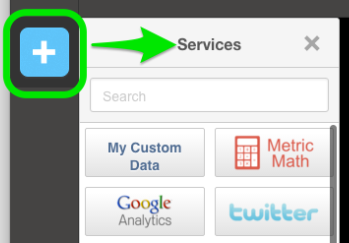
📝 Note: Please note that for most of our out-of-the-box integrations, there is a curated list of available metrics (exceptions include JIRA, Salesforce, and Google Analytics which each offer custom query functionality). Contact us with feedback if a key metric is missing.
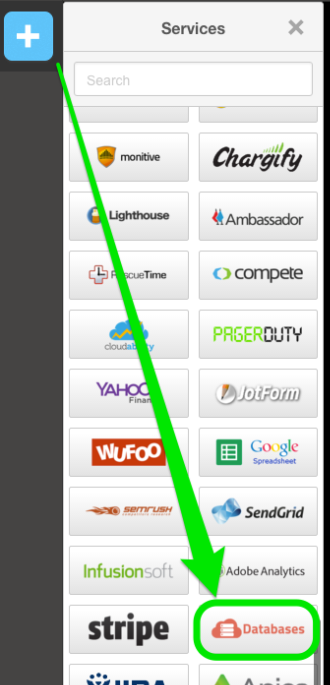
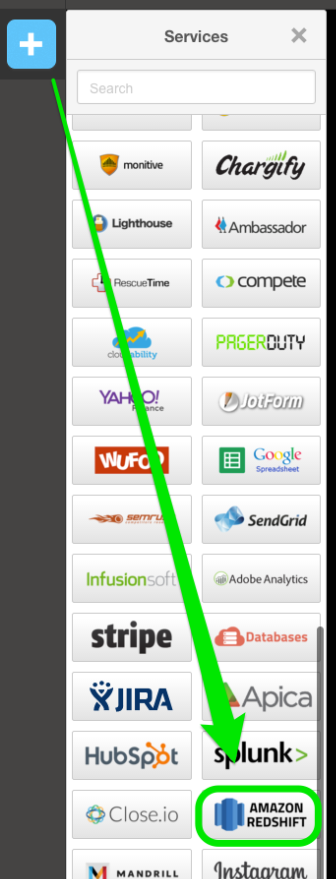
Database connectors—For those users that would like to run direct SQL queries against a database instance, we currently offer several options: Amazon RedShift, MySQL, and PostgreSQL. To leverage these tools, navigate to our Services panel and—for MySQL or PostgreSQL—select the “Databases” tile and then select the format of the data you will be retrieving. Amazon RedShift has a tile of its own within our services panel, with similar data format options. You can find full instructions for DB connectivity in our MySQL, PostgreSQL, and Amazon Redshift connections tutorial.
CSV Upload Tool—For many companies, interactions with company data and KPIs have been reserved to carefully prepared Excel spreadsheets and graphs. While the purpose of AppInsights is to provide your team with live, dynamically updating dashboards, we do not want to invalidate any strong internal processes you have designed around spreadsheet creation.
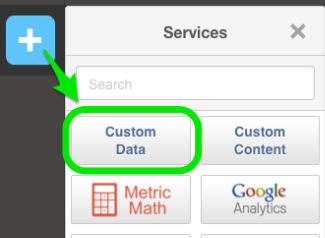
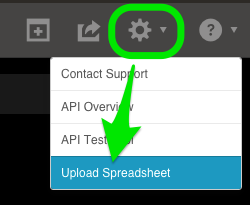
For these reasons, we have designed a tool that will allow you to upload spreadsheet data for representation within AppInsights as long as it is properly formatted to cooperate with our visualizations. To get started, navigate to the “My Custom Data” tile and populate the dashboard with the visualizations you would like to use. Once you have properly formatted you data, you can drag your CSV file to our “Upload Spreadsheet” pane (screenshots below).
For a full step-by-step guide, check out our Upload spreadsheet data to widgets tutorial in our support portal.
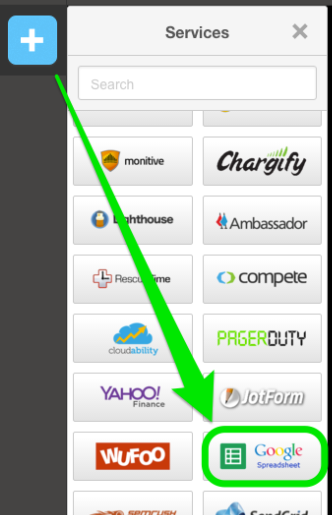
Google Sheet integration—If you are interested in taking your spreadsheet data one step further, you will want to check out our Google Sheet integration. While our CSV Upload Tool requires a fresh upload of data whenever you’d like your visualizations to update, our Google Sheet Integration will allow you to maintain all of your data in an online spreadsheet—anytime you modify the data points or data sets on this sheet, the changes will automatically be reflected in your connected AppInsights widgets.
To get started, navigate to the Google Spreadsheet tile in our Services pane. You can then select the data format and corresponding visualizations you would like to use to represent your data.
For a full step-by-step guide, check out our Connect to Google Sheets tutorial.
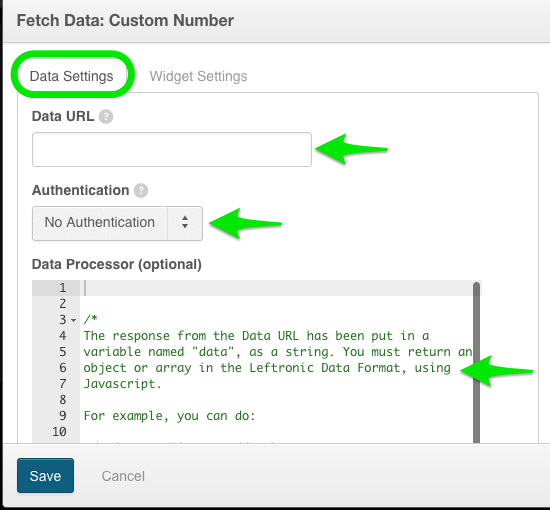
Push and Fetch data tools—For users with a high level of technical aptitude that plan to represent large amounts of custom data within AppInsights, we recommend our custom Push or Fetch data tools. As long as the necessary infrastructure is in place to host your scripts, you can push or pull data into your AppInsights visualizations as quickly as every 10 seconds.
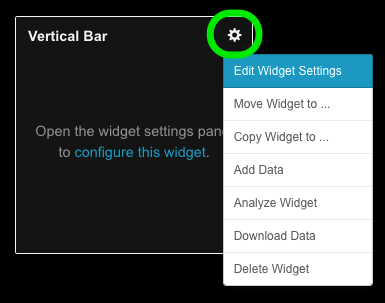
Similar to using our CSV Upload Tool, you will want to start by populating the dashboard with the visualizations you would like to use to represent your data. From there, you can enter the “Edit Widget Settings” menu for each of the visualizations on your dashboard to find the corresponding Access Key and Stream Name identifiers.
For more information, see the API documentation, which includes information on all of the supported packages and libraries. You can also see our tutorials for both the Push and Fetch data tools:
AppInsights API: Push data to widgets
AppInsights API: Fetch data from custom sources

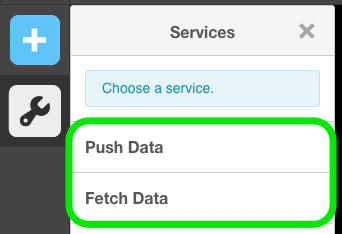
Push Data Tool

Fetch Data Tool
Was this page helpful?
Tell us more…
Help us improve our content. Responses are anonymous.
Thanks
We appreciate your feedback!